
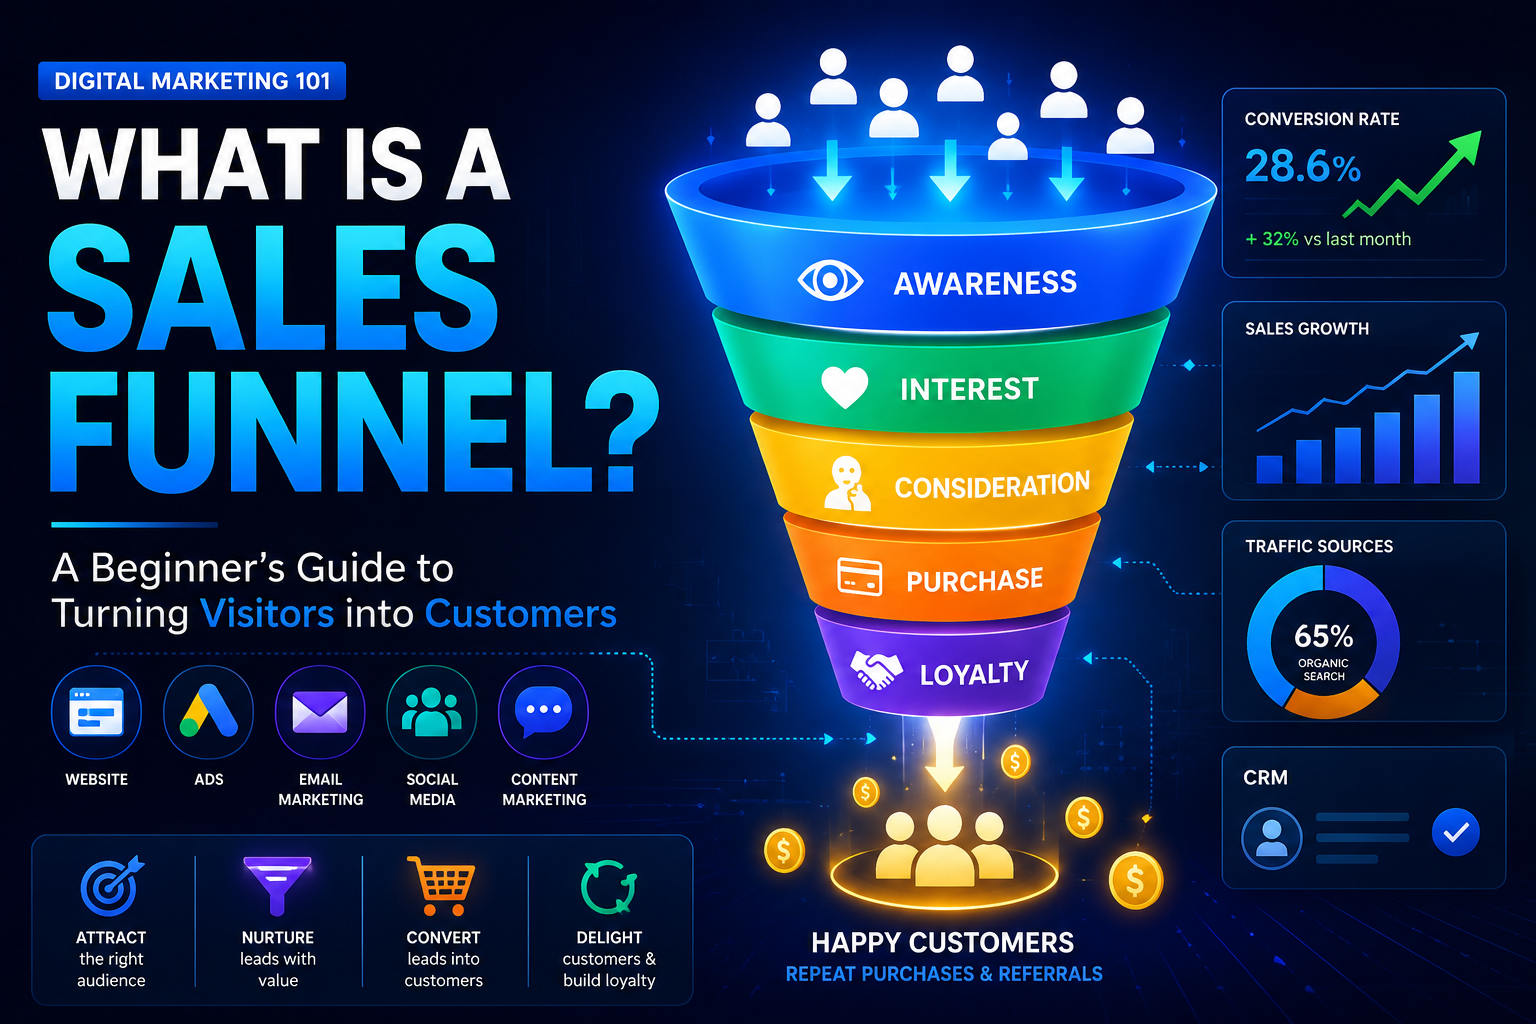
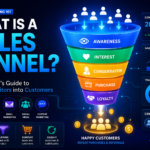
A sales funnel is a model of the customer journey from initial awareness through purchase (and beyond). It helps marketers and sales teams visualize how prospects enter (top of funnel), move through consideration and decision stages, and ultimately convert into customers (bottom of funnel), with only a fraction remaining at each successive stage. In practice, companies use funnel frameworks like AIDA (Attention/Awareness, Interest, Desire, Action) or the modern ToFu/MoFu/BoFu breakdown (Top/Middle/Bottom of Funnel) to structure content and campaigns. At each stage, customers exhibit different behaviors and needs – for example, top-funnel prospects seek education, mid-funnel prospects compare options, and bottom-funnel prospects seek confidence and deals. Key metrics (conversion rates between stages, cost per acquisition, lifetime value, churn, etc.) must be tracked at each stage to diagnose bottlenecks. Optimizing a funnel involves testing (A/B experiments), personalization, retargeting, analytics and alignment of marketing and sales processes. Common pitfalls include poor data (invalid leads, misaligned metrics), overfocus on vanity numbers (e.g. pageviews instead of conversion), and neglecting retention. Funnels vary by industry: e.g. B2B SaaS often uses free-trial→demo→paid stages, while e‑commerce funnels center on browsing→cart→checkout. This report defines sales funnels, compares common models (with Table 1), details stage-by-stage behaviors and tools, lists stage-specific KPIs (Table 2), describes optimization tactics, surveys pitfalls, and illustrates industry examples. Implementation guidance includes a 12-week optimization roadmap (Table 3) and a recommended dashboard structure.
What is a Sales Funnel?
A sales funnel (or marketing funnel) is a visual model of the steps prospects take from first contact through conversion. It typically starts broad at the top (awareness) and narrows to those who ultimately purchase. For example, IBM defines it as “a visual roadmap of the customer journey from initial awareness to final purchase”. Salesforce similarly notes it is the “journey a prospect takes from awareness of a product or service to purchase,” used to track progress and address needs at each step. Unlike a sales pipeline (which lists active deals), a funnel is conceptual, used for analysis and forecasting – highlighting conversion rates and drop-off points through the stages.
The purpose of a funnel is to map and optimize conversion: marketers can see where prospects drop off, improve messaging at each stage, and guide leads systematically toward buying. A well-structured funnel helps teams deliver the right content and calls-to-action at the right time, nurturing leads until they are ready to buy. In practice, marketing and sales teams often align funnels with the customer lifecycle – awareness, interest/consideration, decision, and post-purchase retention – so they can tailor campaigns, measure performance, and allocate resources effectively.
Common Funnel Models and Stage Names
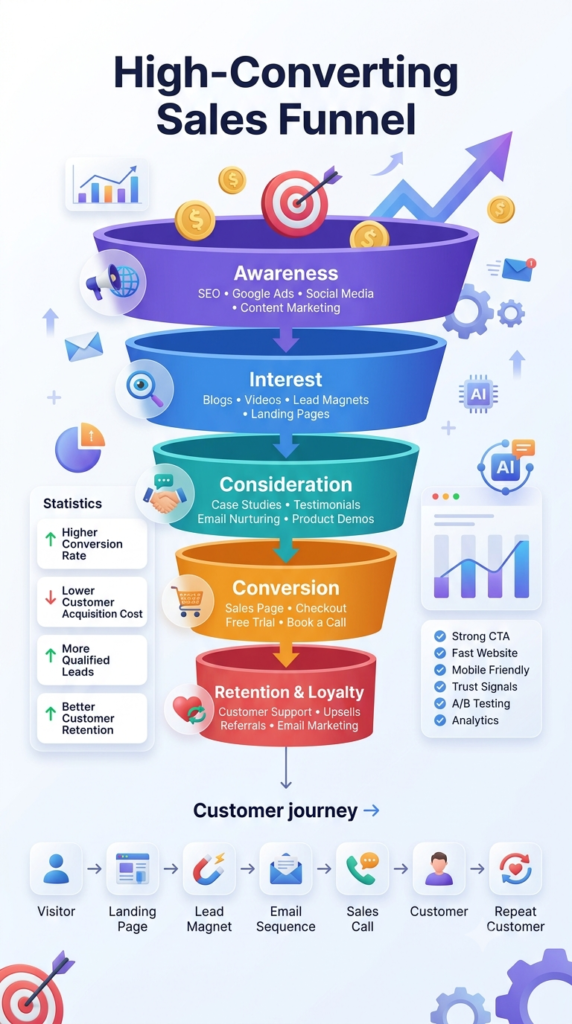
Marketers use several naming conventions and models for funnel stages. AIDA is a classic advertising model: Attention (awareness), Interest, Desire, Action. More modern frameworks combine or expand these stages. For example, many content marketing teams use ToFu/MoFu/BoFu (Top/Middle/Bottom of Funnel) to denote Awareness (ToFu), Consideration (MoFu) and Decision (BoFu) stages. Another common breakdown is Awareness → Consideration → Decision → Loyalty/Retention, capturing post-sale engagement. Table 1 summarizes key models:
| Model / Framework | Stages | Notes |
|---|---|---|
| AIDA | Attention (Awareness) → Interest → Desire → Action | Classic hierarchy-of-effects advertising model. |
| ToFu/MoFu/BoFu | Top (Awareness) → Mid (Consideration) → Bottom (Decision) | Simplified content funnel (digital marketing context). |
| Awareness→Decision (4‑5) | Awareness → Consideration → Decision/Purchase → Loyalty/Retention | Generic buyer’s journey with post-sale stage. |
Each model emphasizes how prospects narrow through the funnel (“funnel shape”): many become aware, fewer move to evaluation, and even fewer convert. Figure below depicts a typical funnel flowchart:
mermaidCopyflowchart LR
    A[Awareness<br/>(ToFu)] --> B[Consideration<br/>(MoFu)]
    B --> C[Decision<br/>(BoFu)]
    C --> D[Purchase<br/>/ Action]
    D --> E[Retention<br/>(Loyalty)]
Stage-by-Stage Objectives and Behaviors
Awareness (Top of Funnel): Prospects become aware of a brand or solution and begin to recognize a need. Their goal is to learn broadly – they browse, search for generic information, or encounter ads and social posts. Effective tactics here include SEO, content marketing, social media, PR, display/search ads, and influencer outreach. The focus is on visibility and interest. Messaging is educational and value-oriented. IBM notes that at this stage “businesses employ tactics such as social media marketing, content creation and targeted advertising to capture attention,” and may use webinars or guides to build authority.
Interest/Consideration (Middle of Funnel): Qualified prospects actively engage and evaluate options. They may sign up for newsletters, download guides, attend webinars, or request demos. Goals include deeper understanding and comparison. Typical behaviors: reading blog articles in depth, comparing features, signing up for trials, and responding to nurture emails. Tools and channels include email campaigns, landing pages with gated content (white papers, case studies), webinars, retargeting ads, live chat/chatbots, and sales outreach. For example, Semrush notes mid-funnel tactics like segmented email nurture flows and retargeting ads to bring visitors back. The sales team may start qualifying leads during this stage (scheduling meetings, demos).
Decision (Bottom of Funnel): Prospects are near-conversion. They compare pricing, seek proof, and address final objections. Typical actions: viewing pricing pages, asking for quotes, or adding items to a cart (in e-commerce). The business provides sales calls, personalized proposals, live demos, and strong CTAs. IBM describes sales rep involvement: “sales team plays a crucial role… offering personalized assistance, addressing concerns and guiding prospects toward a purchasing decision”. Channels include targeted emails, retargeting (e.g. cart-abandonment emails), limited-time offers, money-back guarantees, testimonials and comparison pages. The objective is to convert – a completed purchase or signed contract.
Post-Purchase (Retention/Loyalty): After conversion, focus shifts to satisfaction, retention and advocacy. Objectives include ensuring product adoption, encouraging repeat purchases, upsell/cross-sell, and eliciting referrals or reviews. Common tactics: onboarding emails, customer support, loyalty programs, exclusive offers, and community engagement. IBM calls this “Loyalty and retention,” driving advocacy through excellent service and upsells. Key metrics (below) include churn and customer lifetime value. As one expert notes, retaining customers is often cheaper and more valuable than acquiring new ones, since repeat buyers spend significantly more.
Key Metrics and KPIs by Funnel Stage
Each funnel stage has its own performance metrics. Top-of-funnel KPIs measure awareness and reach (e.g. website traffic, impressions, new visitor count, social engagement, SEO ranking, MQLs). Mid-funnel KPIs focus on engagement and qualification (email open/click rates, content download rates, lead-to-opportunity conversion, webinar attendance, time-on-site). Bottom-funnel KPIs track conversion efficiency and cost: purchase or sign-up conversions, lead-to-customer conversion rate, win rate, average deal size, customer acquisition cost (CAC), and return on ad spend (ROAS). Finally, post-purchase KPIs gauge retention: repeat purchase rate, churn rate, net revenue retention, customer lifetime value (LTV), and satisfaction (NPS). Table 2 summarizes illustrative KPIs by stage:
| Stage | Example KPIs / Metrics |
|---|---|
| Awareness (ToFu) | Impressions/reach; website visitors; new visitors; SEO rank; social mentions; brand search volume; MQLs. |
| Consideration (MoFu) | Lead magnet downloads; email open/click rates; content engagement (time on page, scroll); webinar sign-ups; demo requests. |
| Decision (BoFu) | Quote or cart initiated; trial sign-ups; lead-to-customer conversion rate; sales cycle length; CAC; proposal acceptance; deal win rate. |
| Purchase | Number of orders/sales; sales conversion rate (final stage conv.); average order value; revenue; ROAS. |
| Retention (Loyalty) | Repeat purchase rate; churn rate; customer lifetime value (LTV); net (revenue) retention; upsell/renewal rate; NPS. |
For example, tracking the stage-to-stage conversion rates (e.g. visit→lead, lead→opportunity, opportunity→sale) quickly highlights bottlenecks. The overall funnel conversion (final buyers ÷ initial prospects) is a key high-level KPI. Finance-related metrics (CAC, LTV, payback period) are especially critical in subscription businesses. McCracken Alliance stresses that LTV:CAC ratio and retention determine whether the funnel “economics actually add up”. Funnel analysis tools typically compute these metrics automatically, so teams can spot leaks (e.g. an unusually high drop-off rate between stages) and reallocate effort.
Tools and Channels by Stage
Different marketing channels and tools serve each funnel stage:
- Top of Funnel: SEO (blogs, organic search), content marketing (articles, videos, infographics), social media, PR, display/paid search ads, influencer partnerships, and broad email campaigns. These channels maximize reach and awareness. For instance, companies use digital PR and SEO to boost brand visibility, and social influencers or viral content to attract first-time visitors. Webinars and high-value content (e.g. industry reports) can also drive wide awareness. IBM notes social media, content creation and targeted advertising are key to “capture the attention of potential customers” at this stage.
- Middle of Funnel: Marketing automation (email marketing platforms), landing pages, retargeting ads, webinars, and sales tools. Typical channels include drip email campaigns segmented by behavior, remarketing ads (on social or search), interactive tools (assessments, calculators), and sales demos. For example, segmented email nurture flows keep leads engaged (Semrush highlights email nurtures and retargeting to guide prospects). Live chat/bots (e.g. HubSpot Chatbot) can answer mid-funnel questions in real time. CRM and marketing automation systems (like Salesforce, HubSpot, Marketo) are heavily used here to track lead scores and trigger follow-ups.
- Bottom of Funnel: Sales outreach and conversion-focused marketing. Channels include direct sales calls, personalized email offers, remarketing to cart abandoners, and targeted ads (e.g. dynamic product ads). Content is very specific: case studies, pricing pages, ROI calculators, comparison sheets. Conversion-rate-optimization (CRO) tools (Optimizely, VWO) may run A/B tests on landing pages and CTAs. Phone or video consultations and live demos are common in B2B. Payment and checkout systems are of course essential in e-commerce. IBM emphasizes personalized follow-up and closing tactics (email sequences, sales team engagement) to “navigate the closing process”.
- Retention Stage: Customer success and loyalty channels. Tools include CRM-based nurture sequences (onboarding emails), support/helpdesk systems, loyalty/rewards programs, referral campaigns, and community forums. Customer analytics (Cohort/NPS software) measure engagement. The goal is to make customers advocates. IBM points to “ongoing engagement and upselling or cross-selling” as key. Metrics dashboards should include retention analytics (repeat purchase reports, churn alerts). HubSpot and other CRMs often integrate post-sale pipeline tracking for renewals and expansions.
In summary, effective funnels use a multichannel mix, with content and campaigns tailored to the prospect’s stage. Each channel and tool should be tracked: e.g. Google Analytics for web traffic, CRM for lead status, ad platforms for campaign ROI, email tools for open/click rates, etc. Integration is crucial so that a contact’s journey across channels is unified. (HubSpot notes marketing/sales funnels can be mapped to customer journey data in a CRM.)
Optimization Techniques and Experiments
Improving funnel performance is an iterative process. Common optimization techniques include:
- A/B and Multivariate Testing: Experiment with variations of landing pages, ad creatives, email subject lines, and pricing offers. Ensure tests have clear hypotheses and clean data – test one variable at a time, segment by persona, and use proper tracking. Tools like Optimizely, Google Optimize, VWO, or built-in CRO features (e.g. in analytics suites) help run tests. For example, an e‑commerce firm might A/B-test different checkout flows to reduce cart abandonment. Funnels should be instrumented so that test results feed into the conversion metrics.
- Personalization: Use prospect data (industry, behavior, past purchases) to tailor content. For instance, show different case studies based on vertical, or recommend specific product variants. Dynamic content and account-based marketing (ABM) personalize the funnel. Studies show personalized emails and pages can significantly lift engagement. This may involve AI tools that alter website content or email sequences based on user segment.
- Lead Scoring and Qualification: Assign scores to leads based on actions (downloads, page views, email engagement). Prioritize high-scoring leads for sales follow-up. CRM rules or marketing automation should automatically route qualified leads. This prevents pushing unready leads too quickly and focuses on those likely to convert.
- Retargeting and Drip Campaigns: Use remarketing pixels and email workflows to re-engage visitors who dropped off (e.g. cart abandoners, or readers of a whitepaper). Send tailored messages reminding them of next steps. For example, an online retailer sends cart-abandonment emails with discount codes (sometimes lifting conversion by double-digit percentages). The goal is to reduce stage-to-stage drop-off.
- Funnel Analysis: Continuously analyze funnel data to spot leaks. Visualization tools (funnel charts, cohort analysis) reveal where prospects drop off. For example, if many users leave after a pricing page, that indicates an issue with pricing or messaging. Optimization then targets that step (maybe clarifying value or adjusting price). Regularly segment data by channel, demographic, or campaign to identify underperforming segments (e.g. a specific ad source with low conversion).
- Conversion Rate Optimization (CRO): Beyond A/B, general CRO best practices apply: simplify forms, reduce friction, improve site speed, clarify CTAs, and test layout changes. Even small UX changes (button color, headline copy) can improve funnel flow. Funnel.io cautions against “vanity metrics” – e.g. don’t celebrate high pageviews if no increase in conversions. Instead, optimize for effectiveness: match each funnel stage with meaningful KPIs (Table 2 outlines examples).
- Holistic Reviews: Align marketing and sales by sharing dashboards. As one guide recommends, “build a single shared dashboard…pipeline velocity and stage conversion rates get weekly attention. CAC, LTV, and NRR get monthly executive reviews”. This ensures teams respond quickly to bottlenecks (e.g. if MQL→SQL conversion drops, adjust content or qualification).
By iterating with data-driven tests, teams can gradually improve the funnel’s conversion efficiency and address issues where prospects leak out.
Common Pitfalls and How to Avoid Them
Even a well-designed funnel can fail if mismanaged. Frequent pitfalls include:
- Poor Data/Attribution: Fragmented or inaccurate data leads to false conclusions. Examples: duplicate contacts in CRM, bot/spam traffic inflating counts, or misaligned tracking across devices. Funnel.io warns of “bad data” from bot traffic or mismatched attribution (mixing email vs direct clicks) which can mislead A/B tests. Avoidance: Cleanse your data regularly (validate emails, dedupe leads), implement unified tracking (UTM parameters, multi-touch attribution models) and use consistent stage definitions.
- Chasing Vanity Metrics: Focusing on superficial metrics (pageviews, impressions, open rates) without tying them to conversion or value. For instance, boosting site traffic but not improving sign-ups is futile. Funnel.io emphasizes “don’t use vanity metrics to implement funnel optimization”. Instead, align metrics with business goals at each stage (Table 2). Review conversion rates between stages, and track value metrics (e.g. LTV per cohort) to ensure efforts improve the bottom line.
- Misalignment of Sales and Marketing: When marketing generates leads that sales doesn’t follow up on (or vice versa), the funnel stalls. For example, marketing may declare “MQLs” but lack criteria for when to hand off. Avoidance: Define the funnel stages and handoff points collaboratively (Service Level Agreements). Use a shared CRM so that lead status is transparent. Regularly review where leads languish.
- Neglecting Later Stages: Many funnels end at first purchase and ignore retention. However, post-sale activities (support, upsell, renewals) are crucial. McCracken Alliance stresses that retention “determines whether your entire business model works”. Too often teams overlook loyalty until churn is high. Avoidance: Extend the funnel to include retention stage. Track LTV and churn, invest in customer success and measure referral rates.
- Over-Testing or Wrong Testing: Running too many experiments without focus can mislead. Funnel.io cites “running tests that mislead more than inform” when too many variables are changed or segmentation isn’t applied. Avoidance: Formulate clear hypotheses (e.g. “adding social proof will raise trial signups”), test one element at a time, and use statistically sound sample sizes. If testing personalization, ensure each variant targets the right segment.
By anticipating these issues, teams can build controls (data audits, aligned KPIs, joint meetings) to keep the funnel reliable. For example, set thresholds to trigger action (e.g. if traffic-to-lead rate falls below a benchmark), and document playbooks (“If MQL-to-SQL drops, sales reviews recent leads”).
Industry Variations and Examples
Funnels are tailored by industry and business model:
- B2B SaaS: Often a free trial/freemium → demo → paid subscription funnel. Prospects may spend weeks in evaluation. For example, Amplitude notes that in a typical free-to-paid SaaS funnel, the largest drop-off is usually between trial sign-up and upgrade. Teams address this by improving trial onboarding and educating users on premium features. In one case study, the 8×8/Jitsi video conferencing team discovered via funnel analysis that promotion of a Chrome extension significantly improved retention – users who installed it were twice as likely to be active on day 7.
- E-commerce/Retail: The funnel is website visitor → product view → add-to-cart → checkout → purchase → (optional repeat purchase). Cart abandonment is a well-known challenge (often 60–80% of carts abandoned). For instance, an Atlassian example funnel showed a large drop-off before “Add to Cart,” while the cart-to-purchase conversion was high. Retailers combat this with abandoned-cart emails, simplified checkouts, and remarketing ads. Amplitude reports that Rappi (Latin American delivery app) used A/B tests on trial pricing and shipping costs: offering free shipping over a threshold increased average order value by 15%.
- Consumer Tech/Apps: A funnel might be ad click → app signup → core usage → paid features. Mobile apps often track install → registration → first key action (e.g. profile completion) → paid transaction. MINDBODY (fitness booking app) found via funnel analysis that engagement with a new “Activity Dashboard” feature led to 24% more bookings, guiding UX prioritization.
- Services (Consulting, Agencies): Funnels often start with lead generation (e.g. content, referrals), then a discovery call → proposal → contract. A consultancy may use e-books and webinars (ToFu), case studies and calls (MoFu), and contractual proposals (BoFu). Key is multi-stakeholder buying: deals may require C-suite buy-in. For example, a B2B consulting firm might discover long delay between proposal and close; they could streamline by adding pricing worksheets to proposals (reducing friction). Weaker conversion might also stem from not qualifying budget/authority early (TOFU qualification).
- Financial Services/Fintech: Funnels involve account creation and funding steps. Many sign-ups drop off at funding/payment step. QuickBooks (Intuit) found that cutting unnecessary onboarding steps improved account activation by 25%. Payment flows are optimized for frictionless transfer (one-click top-ups, saved bank info)
Each example above can be visualized in a funnel chart (see Fig.1) that shows numerical drop-offs. For instance, the Atlassian funnel (Fig.1) illustrates how 68% of email recipients drop off before clicking a promotion, whereas 92% of users with an item in cart proceed to purchase. This highlights the importance of addressing the largest leaks first.
Figure 1. Example funnel chart showing stage-to-stage drop-offs (email campaign funnel). Note large drop between the first two stages and high retention once in cart (source: Atlassian).
Implementation Checklist and Dashboard
Checklist for building/optimizing a funnel:
- Define Funnel Stages: Collaboratively map out your stages (e.g. Lead, MQL, SQL, Opportunity, Customer). Ensure both marketing and sales agree on definitions.
- Set Goals & KPIs: Establish target conversion rates and volumes per stage, and key financial metrics (CAC, LTV, payback, NRR). Align metrics to business objectives to avoid vanity indicators.
- Integrate Analytics: Implement tracking across channels (Google Analytics events, CRM fields, ad pixels). Ensure first-touch and last-touch attribution are captured.
- Centralize Data: Create a unified dashboard (e.g. in BI tools or the CRM) so all stakeholders use the same numbers. Clearout recommends “one shared dashboard” and documenting thresholds for ‘healthy’ vs ‘urgent’.
- Audit Content and Channels: Review your assets at each stage (SEO health, ad performance, email sequences, sales scripts). Identify gaps where prospects lack content or are prematurely pushed for sale.
- Test and Iterate: Launch experiments (A/B tests, new campaigns) focused on weakest stages. Use statistical tools to evaluate lift.
- Automate and Personalize: Leverage CRM/marketing platforms to automate lead nurturing and tailor communications. For example, use dynamic email content or website personalization for returning visitors.
- Monitor and Learn: Set up regular review meetings. Use funnel visualization to spot bottlenecks. When a drop-off is detected, form hypotheses (e.g. messaging mismatch, technical issues) and test solutions.
Recommended Dashboard Layout: A typical funnel dashboard shows stage counts and conversion rates between them (see Table 2 for example metrics). It should include real-time CRM pipeline views and marketing data. Key elements: current number of prospects at each stage, percent of stage-to-stage conversions, average time in stage (velocity), CAC and LTV. For example, Clearout suggests reviewing pipeline velocity and conversion weekly, while CAC, LTV and net retention get monthly executive focus. Dashboards may also break down by acquisition channel or campaign. Graphical charts (bar or funnel charts) can highlight where losses occur.
Sample 12-Week Optimization Timeline: Table 3 illustrates a phased plan to audit and improve a funnel. Each phase lasts ~2 weeks, combining measurement and iterative tests. During Weeks 1–2, focus on setup (data collection, baseline metrics, stage definition). Weeks 3–4 tune top-of-funnel (SEO, content, ad copy) and run awareness campaigns. Weeks 5–6 launch A/B tests on landing pages and messaging. Weeks 7–8 optimize mid-funnel by refining email drips, lead scoring rules, and adding or improving lead magnets. Weeks 9–10 address bottom-of-funnel: test calls-to-action, pricing, and sales handoff procedures. Weeks 11–12 analyze results, implement winning variations, and document learnings for next cycle.
| Weeks | Focus / Activities | Key Metrics / Goals |
|---|---|---|
| 1–2 | Audit & Baseline: Define stages; ensure CRM/analytics tracking; gather current funnel data (traffic, leads, conversions). | Establish baseline conversion rates and drop-offs. |
| 3–4 | Top-Funnel Optimization: Refine SEO/content strategy; test new ad channels or creatives; segment audiences. | Increase Top-Funnel volume (visitors, MQLs) and traffic-to-lead rate. |
| 5–6 | Landing Page & Messaging Tests: A/B test headlines, CTAs, page layouts; improve content relevance. | Improve click-to-lead conversion on landing pages (e.g. +X%). |
| 7–8 | Mid-Funnel Nurture: Optimize email nurture sequences, lead magnets, and retargeting ads; implement personalization. | Raise email open/click rates, content conversion (e.g. lead magnet downloads), demo requests. |
| 9–10 | Bottom-Funnel Deals: Test pricing or package offers; streamline checkout/sales process; train sales reps on objections. | Increase lead-to-customer conversion and reduce CAC. |
| 11–12 | Review & Scale: Analyze KPIs across stages; implement winning variants; plan next iterations. | Achieve target improvements (e.g. +% in overall conversion, better LTV:CAC ratio). |
The above timeline can be adjusted per organization. The key is continuous measurement – after week 12 the cycle repeats, constantly pushing the funnel’s efficiency higher.
Conclusion
A sales funnel is a fundamental framework for understanding and optimizing customer acquisition. By clearly defining each funnel stage and aligning content, channels, and sales activities accordingly, businesses can systematically guide prospects toward purchase. Rigorous tracking of metrics (as in Table 2) and the disciplined execution of tests (A/B, personalization, retargeting) reveal where prospects are lost and what fixes work. Avoiding common pitfalls (dirty data, vanity metrics, misaligned goals) and iterating through well-planned experiments yields measurable improvements. Finally, industry context matters: B2B sales cycles, ecommerce behaviors, or service engagements each shape the funnel’s structure and benchmarks. By following an implementation roadmap and monitoring a unified dashboard, teams can continuously refine the funnel to boost conversions, reduce costs, and maximize customer lifetime value.
Sources: Authoritative marketing and analytics publications (IBM, Salesforce, HubSpot), industry research (Semrush, Atlassian, Amplitude, etc.) and academic sources informed this analysis. Tables and figures are derived from these sources or constructed for illustrative purposes.
Frequently Asked Questions
1. What is a sales funnel?
A sales funnel is a step-by-step process that guides potential customers from discovering your business to making a purchase and becoming loyal customers. It helps businesses understand the customer journey and improve conversions at every stage.
2. Why is a sales funnel important for businesses?
A sales funnel helps businesses generate qualified leads, increase conversion rates, reduce customer acquisition costs, and build long-term customer relationships. It also makes marketing and sales efforts more measurable and effective.
3. What are the main stages of a sales funnel?
The typical sales funnel consists of five stages:
- Awareness
- Interest
- Consideration
- Decision
- Action (Purchase)
Many businesses also add a sixth stage: Retention and Advocacy.
4. What is the difference between a sales funnel and a marketing funnel?
A marketing funnel focuses on attracting and nurturing leads through marketing activities, while a sales funnel emphasizes converting those qualified leads into paying customers. In many businesses, both work together as part of the customer journey.
5. How can I build an effective sales funnel?
To build an effective sales funnel:
- Define your target audience.
- Create valuable content.
- Capture leads with landing pages or forms.
- Nurture leads through email marketing.
- Offer a compelling solution.
- Optimize your checkout or contact process.
- Follow up after the sale.
6. Which tools can I use to create a sales funnel?
Popular sales funnel tools include:
- ClickFunnels
- HubSpot
- GoHighLevel
- Systeme.io
- Leadpages
- WordPress + Elementor
- Mailchimp
- ActiveCampaign
- Google Analytics
- Meta Ads Manager
7. What are the key metrics to measure a sales funnel?
Important sales funnel metrics include:
- Conversion Rate
- Click-Through Rate (CTR)
- Cost Per Lead (CPL)
- Customer Acquisition Cost (CAC)
- Customer Lifetime Value (CLV)
- Bounce Rate
- Average Order Value (AOV)
- Lead-to-Customer Conversion Rate
8. Why do customers drop out of a sales funnel?
Customers may leave a funnel because of:
- Poor website experience
- Slow page loading
- Lack of trust
- Weak call-to-action
- Complicated checkout process
- Irrelevant content
- High pricing without clear value
- Insufficient follow-up
9. Can small businesses benefit from a sales funnel?
Absolutely. A well-designed sales funnel helps small businesses attract qualified leads, automate follow-ups, improve conversion rates, and compete effectively with larger brands while maximizing their marketing budget.
10. How can AI improve a sales funnel?
AI can enhance sales funnels by:
- Personalizing customer experiences
- Automating lead qualification
- Powering chatbots for instant support
- Predicting customer behavior
- Optimizing email campaigns
- Improving ad targeting
- Recommending products based on user behavior

Leave a Reply